Objective#
- Create a Monitoring solution ( Metrics ) using secure ways to monitor multiple EKS clusters
End Result#

- Note : Code blocks are long in the last few sections, use the toggle to view and code and close it when needed.
Setup the following exporters on each cluster#
- Create a namespace named monitoring where we will deploy all the monitoring related pods
kubectl create ns monitoring- Add the following helm repo for installing the upcoming charts and update it
helm repo add prometheus-community https://prometheus-community.github.io/helm-charts
helm repo updateBlackbox-https#
- This component is used for collecting website uptime status, ssl details and many more
- Install Blackbox Exporter using the following helm command
helm install blackbox-exporter prometheus-community/prometheus-blackbox-exporter --namespace monitoringNode Exporter#
- This component is used for collecting details about kubernetes worker nodes
- Install Node Exporter using the following command
helm install node-exporter prometheus-community/prometheus-node-exporter --namespace monitoringKube-State-Metrics#
- This component is used for collecting Kubernetes Object Status like Deployment Availability, Pod status etc
- Install Kube State Metrics using the following command
helm install kube-state-metrics prometheus-community/kube-state-metrics --namespace monitoringSetup Prometheus Shard on the clusters that needs to be monitored#
- Prometheus Shard refers to the prometheus instances that will be deployed on all the secondary clusters that will store the data temporarily ( ideally for a few days ) , which will be scraped by the Central Prometheus for permanent Storage
- For setting up a Prometheus Shard, we will collect all the metrics that is deployed to the cluster and keep it ready for retrieval by the Prometheus Central
- We will use the following yaml file for deploying the Prometheus Shard, save the file as prometheus-shard.yaml
- Add the Prometheus Helm repo and update
helm repo add prometheus-community https://prometheus-community.github.io/helm-charts
helm repo updatealertmanager:
enabled: false
kube-state-metrics:
enabled: false
prometheus-node-exporter:
enabled: false
prometheus-pushgateway:
enabled: false
server:
retention: '2d'
persistentVolume:
size: 10Gi
serverFiles:
prometheus.yml:
scrape_configs:
- job_name: 'kube-state-metrics'
scrape_interval: 15s
static_configs:
- targets: ['kube-state-metrics.monitoring.svc.cluster.local:8080']
labels:
cluster: 'cluster-name'
- job_name: 'node-exporter'
kubernetes_sd_configs:
- role: pod
namespaces:
names:
- monitoring
relabel_configs:
- source_labels: [__meta_kubernetes_pod_label_app_kubernetes_io_name]
regex: prometheus-node-exporter
action: keep
- source_labels: [__meta_kubernetes_pod_ip]
action: replace
target_label: __address__
regex: (.+)
replacement: $1:9100
- target_label: cluster
replacement: cluster-name
- job_name: 'blackbox-https'
scrape_interval: 15s
metrics_path: /probe
params:
module: [http_2xx]
static_configs:
- targets:
- https://your-website.com
relabel_configs:
- source_labels: [__address__]
target_label: __param_target
- source_labels: [__param_target]
target_label: instance
- target_label: __address__
replacement: blackbox-exporter-prometheus-blackbox-exporter.monitoring.svc.cluster.local:9115
- target_label: cluster
replacement: 'cluster-name'- Replace the cluster-name with desired names for later filtering in dashboards.
- Also replace the targets in blackbox-https job with desired targets
- Use the following command to install Prometheus using Helm
helm install prometheus prometheus-community/prometheus --namespace monitoring -f prometheus-shard.yamlSetup a Central Prometheus for collecting all the metrics from Other clusters#
- Before setting up a Central Prometheus, we need to make sure that we can collect metrics from all the clusters with proper authentication.
- We will collect the metrics using the Kubernetes API Endpoint that we got from the EKS Console
- For collecting the metrics using this method, we need to setup a service account in each cluster and get the credentials
- That credentials need to be stored as secrets in the Central Cluster and will reference that credentials in the prometheus-values.yaml in the Central Cluster
- First switch to the secondary cluster where you want to generate the credentials
Setup a Service Account#
- To create a service account in each cluster save the following yaml as sa.yaml and apply it
apiVersion: v1
kind: ServiceAccount
metadata:
  name: prometheus-federation
  namespace: monitoring
---
apiVersion: rbac.authorization.k8s.io/v1
kind: Role
metadata:
  name: prometheus-federation-reader
  namespace: monitoring
rules:
  - apiGroups: ['']
    resources: ['services/proxy']
    verbs: ['get', 'list']
---
apiVersion: rbac.authorization.k8s.io/v1
kind: RoleBinding
metadata:
  name: prometheus-federation-reader-binding
  namespace: monitoring
subjects:
  - kind: ServiceAccount
    name: prometheus-federation
    namespace: monitoring
roleRef:
  kind: Role
  name: prometheus-federation-reader
  apiGroup: rbac.authorization.k8s.io
kubectl apply -f sa.yamlGet Credentials of the above created service account#
- Create a file named credentials.yaml and apply it
kind: Secret
metadata:
  name: prometheus-federation-token
  namespace: monitoring
  annotations:
    kubernetes.io/service-account.name: prometheus-federation
type: kubernetes.io/service-account-token
kubectl apply -f credentials.yaml- Now we need to extract the credentials that we created so that we can store it in the Central Prometheus
SECRET=prometheus-federation-token
NAMESPACE=monitoring

kubectl get secret $SECRET -n $NAMESPACE -o jsonpath='{.data.token}' | base64 -d > env-token

kubectl get secret $SECRET -n $NAMESPACE -o jsonpath='{.data.ca\.crt}' | base64 -d > env-ca.crt- The extracted credentials will now be saved to your local disk. Time to load them into the primary cluster, so that it can communicate to the clusters with authentication
Setup the Central Prometheus#
- Now we store the credentials that we got above
- Switch to the primary cluster now.
kubectl create secret generic env-cluster-token --from-file=env-token --from-file=env-ca.crt -n monitoring- Now that we have the required credentials, we can proceed towards setting up the Promtheus Central
- Use the following file for setting up the Central Prometheus
alertmanager:
  enabled: false

kube-state-metrics:
  enabled: false

prometheus-node-exporter:
  enabled: false

prometheus-pushgateway:
  enabled: false

server:
  retention: 10d
  persistentVolume:
    size: 25Gi
  extraVolumeMounts:
    - name: <env>-cluster-credentials
      mountPath: /etc/prometheus/<env>
      readOnly: true

  extraVolumes:
    - name: <env>-cluster-credentials
      secret:
        secretName: <env>-cluster-token

serverFiles:
  prometheus.yml:
    scrape_configs:
      - job_name: '<env>-cluster'
        scheme: https
        scrape_interval: 15s
        metrics_path: /api/v1/namespaces/monitoring/services/prometheus-server:80/proxy/federate
        params:
          'match[]':
            - '{job="blackbox-https"}'
            - '{job="kube-state-metrics"}'
            - '{job="node-exporter"}'
        static_configs:
          - targets:
              - <cluster-endpoint>:443
        bearer_token_file: /etc/prometheus/<env>/token
        tls_config:
          ca_file: /etc/prometheus/<env>/ca.crt
insecure_skip_verify: false- Use the following command to setup the Central Prometheus
helm install prometheus prometheus-community/prometheus --namespace monitoring -f prometheus-central.yaml- Replace the env word with your desired names, for example dev-cluster or qa cluster etc.
- Note : Make sure you paste the cluster endpoint without the https part of the url.
- For example :
my-cluster.sk1.us-west-2.eks.amazonaws.com
- For example :
- Replace the service name in
metrics_path, currently its prometheus-server, but it may change depending on the release name you choose while installing the chart.
Setup Grafana#
- Grafana will be the metrics visualizing tool
- Grafana will connect to the Central Promtheus where all the data is stored for permanent storage
- We will use helm to install Grafana along with configuring email credentials so that Grafana can send emails when alerts are triggered.
- Use the following command to get the helm repo and update the charts
helm repo add grafana https://grafana.github.io/helm-charts
helm repo update- Create a secret containing the username and password for the smtp user that you want to configure
kubectl create secret generic grafana-smtp-secret \
  --from-literal=user='your_smtp_user' \
  --from-literal=password='your_smtp_password' \
-n monitoring- Save the following yaml as grafana.yaml
adminUser: admin
adminPassword: 'YourSecureAdminPassword'

persistence:
  enabled: true
  storageClassName: gp3
  accessModes:
    - ReadWriteOnce
  size: 2Gi

service:
  type: ClusterIP
  port: 80

serviceAccount:
  create: true
  name: grafana-sa

grafana.ini:
  smtp:
    enabled: true
    host: <smtp_host>:587
    user: ${SMTP_USER}
    password: ${SMTP_PASSWORD}
    from_address: <email_address>
    from_name: Grafana
    skip_verify: false

smtp:
  existingSecret: grafana-smtp-secret
  userKey: user
passwordKey: password- Replace the smtp host with the smtp server you are using.
- Also replace the adminPassword field with your required password
- Use the following command to install grafana using helm with above config file
helm install grafana grafana/grafana -f grafana.yaml --namespace monitoringSetup Dashboard for Monitoring Metrics#
- You can use a prebuilt dashboard available from here
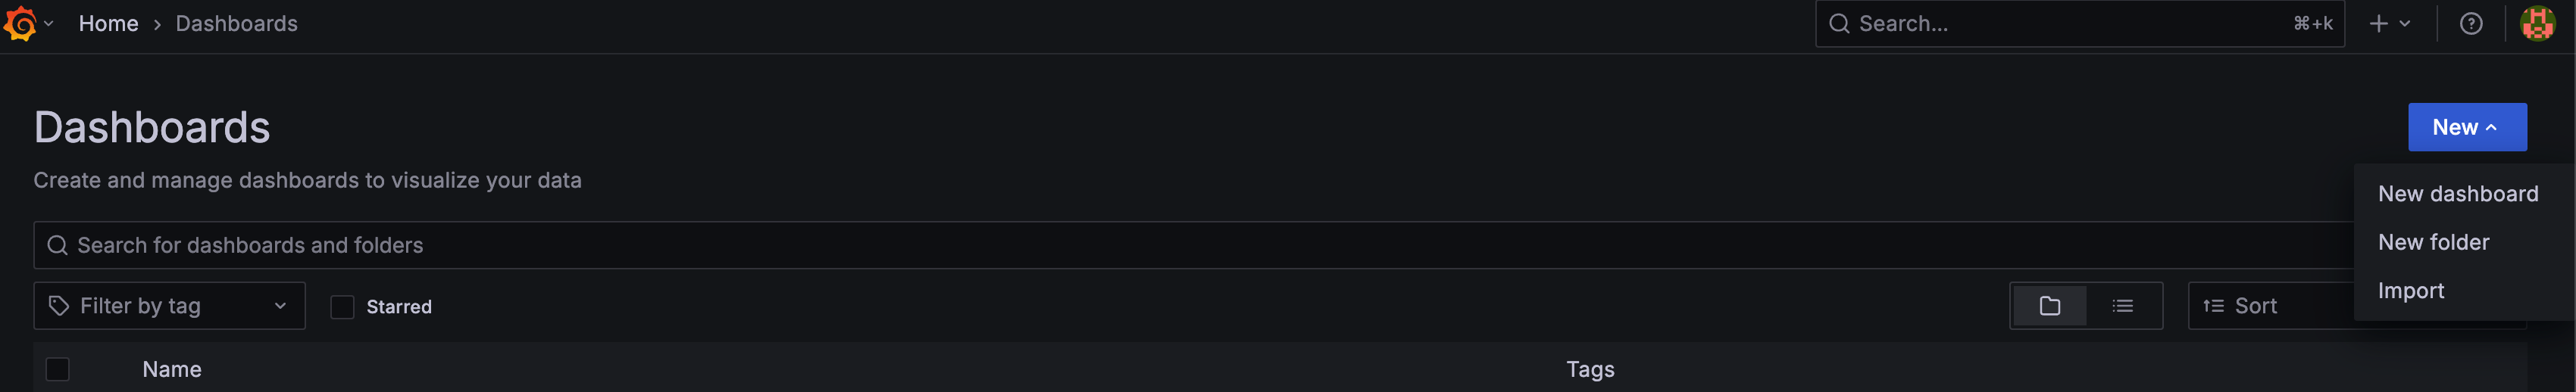
- I have already built a dashboard and will provide the json you can import.
- Click on create a new dashboard and choose import and paste the following json
Dashboard JSON File
{
"__inputs": [
{
"name": "DS_PROMETHEUS",
"label": "prometheus",
"description": "",
"type": "datasource",
"pluginId": "prometheus",
"pluginName": "Prometheus"
}
],
"__elements": {},
"__requires": [
{
"type": "panel",
"id": "alertlist",
"name": "Alert list",
"version": ""
},
{
"type": "panel",
"id": "gauge",
"name": "Gauge",
"version": ""
},
{
"type": "grafana",
"id": "grafana",
"name": "Grafana",
"version": "12.1.1"
},
{
"type": "datasource",
"id": "prometheus",
"name": "Prometheus",
"version": "1.0.0"
},
{
"type": "panel",
"id": "timeseries",
"name": "Time series",
"version": ""
}
],
"annotations": {
"list": [
{
"builtIn": 1,
"datasource": {
"type": "grafana",
"uid": "-- Grafana --"
},
"enable": true,
"hide": true,
"iconColor": "rgba(0, 211, 255, 1)",
"name": "Annotations & Alerts",
"type": "dashboard"
}
]
},
"editable": true,
"fiscalYearStartMonth": 0,
"graphTooltip": 0,
"id": null,
"links": [],
"panels": [
{
"gridPos": {
"h": 7,
"w": 24,
"x": 0,
"y": 0
},
"id": 15,
"options": {
"alertInstanceLabelFilter": "",
"alertName": "",
"dashboardAlerts": false,
"groupBy": [],
"groupMode": "default",
"maxItems": 20,
"showInactiveAlerts": false,
"sortOrder": 1,
"stateFilter": {
"error": true,
"firing": true,
"noData": false,
"normal": false,
"pending": true,
"recovering": true
},
"viewMode": "list"
},
"pluginVersion": "12.1.1",
"title": "Firing Alerts List",
"type": "alertlist"
},
{
"datasource": {
"type": "prometheus",
"uid": "${DS_PROMETHEUS}"
},
"fieldConfig": {
"defaults": {
"color": {
"mode": "palette-classic"
},
"custom": {
"axisBorderShow": false,
"axisCenteredZero": false,
"axisColorMode": "text",
"axisLabel": "",
"axisPlacement": "auto",
"barAlignment": 0,
"barWidthFactor": 0.6,
"drawStyle": "line",
"fillOpacity": 0,
"gradientMode": "none",
"hideFrom": {
"legend": false,
"tooltip": false,
"viz": false
},
"insertNulls": false,
"lineInterpolation": "linear",
"lineWidth": 1,
"pointSize": 5,
"scaleDistribution": {
"type": "linear"
},
"showPoints": "auto",
"spanNulls": false,
"stacking": {
"group": "A",
"mode": "none"
},
"thresholdsStyle": {
"mode": "off"
}
},
"mappings": [],
"thresholds": {
"mode": "absolute",
"steps": [
{
"color": "green",
"value": 0
},
{
"color": "red",
"value": 80
}
]
}
},
"overrides": []
},
"gridPos": {
"h": 7,
"w": 13,
"x": 0,
"y": 7
},
"id": 14,
"options": {
"legend": {
"calcs": [],
"displayMode": "list",
"placement": "bottom",
"showLegend": true
},
"tooltip": {
"hideZeros": false,
"mode": "single",
"sort": "none"
}
},
"pluginVersion": "12.1.1",
"targets": [
{
"editorMode": "code",
"expr": "probe_http_status_code{cluster=\"$cluster\"}",
"legendFormat": "{{exported_instance}} {{instance}} / {{cluster}}",
"range": true,
"refId": "A",
"datasource": {
"type": "prometheus",
"uid": "${DS_PROMETHEUS}"
}
}
],
"title": "Website Status",
"type": "timeseries"
},
{
"gridPos": {
"h": 8,
"w": 11,
"x": 13,
"y": 7
},
"id": 16,
"options": {
"alertInstanceLabelFilter": "",
"alertName": "",
"dashboardAlerts": false,
"groupBy": [],
"groupMode": "default",
"maxItems": 20,
"showInactiveAlerts": false,
"sortOrder": 1,
"stateFilter": {
"error": true,
"firing": true,
"noData": false,
"normal": false,
"pending": true,
"recovering": true
},
"viewMode": "stat"
},
"pluginVersion": "12.1.1",
"title": "Alerts Firing",
"type": "alertlist"
},
{
"datasource": {
"type": "prometheus",
"uid": "${DS_PROMETHEUS}"
},
"fieldConfig": {
"defaults": {
"color": {
"mode": "palette-classic"
},
"custom": {
"axisBorderShow": false,
"axisCenteredZero": false,
"axisColorMode": "text",
"axisLabel": "",
"axisPlacement": "auto",
"barAlignment": 0,
"barWidthFactor": 0.6,
"drawStyle": "line",
"fillOpacity": 0,
"gradientMode": "none",
"hideFrom": {
"legend": false,
"tooltip": false,
"viz": false
},
"insertNulls": false,
"lineInterpolation": "linear",
"lineWidth": 1,
"pointSize": 5,
"scaleDistribution": {
"type": "linear"
},
"showPoints": "auto",
"spanNulls": false,
"stacking": {
"group": "A",
"mode": "none"
},
"thresholdsStyle": {
"mode": "off"
}
},
"decimals": 0,
"mappings": [],
"max": 1,
"thresholds": {
"mode": "absolute",
"steps": [
{
"color": "green",
"value": 0
},
{
"color": "red",
"value": 80
}
]
}
},
"overrides": []
},
"gridPos": {
"h": 7,
"w": 13,
"x": 0,
"y": 14
},
"id": 13,
"options": {
"legend": {
"calcs": [],
"displayMode": "list",
"placement": "bottom",
"showLegend": true
},
"tooltip": {
"hideZeros": false,
"mode": "single",
"sort": "none"
}
},
"pluginVersion": "12.1.1",
"targets": [
{
"editorMode": "code",
"expr": "avg_over_time(kube_deployment_status_condition{condition=\"Available\", status=\"false\",cluster=\"$cluster\"}[2m:])\nor\navg_over_time(kube_deployment_status_condition{condition=\"Progressing\", status=\"false\",cluster=\"$cluster\"}[2m:])",
"legendFormat": "{{deployment}} / {{cluster}}",
"range": true,
"refId": "A",
"datasource": {
"type": "prometheus",
"uid": "${DS_PROMETHEUS}"
}
}
],
"title": "Deployment Failing",
"type": "timeseries"
},
{
"datasource": {
"type": "prometheus",
"uid": "${DS_PROMETHEUS}"
},
"fieldConfig": {
"defaults": {
"color": {
"mode": "thresholds"
},
"fieldMinMax": false,
"mappings": [],
"max": 100,
"min": -1,
"thresholds": {
"mode": "absolute",
"steps": [
{
"color": "green",
"value": 0
},
{
"color": "red",
"value": 70
},
{
"color": "#EAB839",
"value": 100
}
]
},
"unit": "percent"
},
"overrides": []
},
"gridPos": {
"h": 5,
"w": 5,
"x": 13,
"y": 15
},
"id": 8,
"options": {
"minVizHeight": 75,
"minVizWidth": 75,
"orientation": "auto",
"reduceOptions": {
"calcs": ["lastNotNull"],
"fields": "",
"values": false
},
"showThresholdLabels": false,
"showThresholdMarkers": true,
"sizing": "auto"
},
"pluginVersion": "12.1.1",
"targets": [
{
"editorMode": "code",
"expr": "100 - (avg by(instance) (irate(node_cpu_seconds_total{mode=\"idle\",cluster=\"$cluster\"}[2m])) * 100)",
"hide": true,
"legendFormat": "__auto",
"range": true,
"refId": "A",
"datasource": {
"type": "prometheus",
"uid": "${DS_PROMETHEUS}"
}
},
{
"datasource": {
"type": "prometheus",
"uid": "${DS_PROMETHEUS}"
},
"editorMode": "code",
"expr": "100 - (avg(irate(node_cpu_seconds_total{mode=\"idle\",cluster=\"$cluster\"}[2m])) * 100)",
"hide": false,
"instant": false,
"legendFormat": "__auto",
"range": true,
"refId": "B"
}
],
"title": "Cluster Average CPU",
"type": "gauge"
},
{
"datasource": {
"type": "prometheus",
"uid": "${DS_PROMETHEUS}"
},
"fieldConfig": {
"defaults": {
"color": {
"mode": "thresholds"
},
"fieldMinMax": false,
"mappings": [],
"max": 100,
"min": 0,
"thresholds": {
"mode": "absolute",
"steps": [
{
"color": "green",
"value": 0
},
{
"color": "red",
"value": 70
}
]
},
"unit": "percent"
},
"overrides": []
},
"gridPos": {
"h": 5,
"w": 6,
"x": 18,
"y": 15
},
"id": 9,
"options": {
"minVizHeight": 75,
"minVizWidth": 75,
"orientation": "auto",
"reduceOptions": {
"calcs": ["lastNotNull"],
"fields": "",
"values": false
},
"showThresholdLabels": false,
"showThresholdMarkers": true,
"sizing": "auto"
},
"pluginVersion": "12.1.1",
"targets": [
{
"editorMode": "code",
"expr": "sum by (cluster) (node_memory_MemTotal_bytes - node_memory_MemAvailable_bytes{cluster=\"$cluster\"})\n/\nsum by (cluster) (node_memory_MemTotal_bytes{cluster=\"$cluster\"})\n* 100",
"legendFormat": "__auto",
"range": true,
"refId": "A",
"datasource": {
"type": "prometheus",
"uid": "${DS_PROMETHEUS}"
}
}
],
"title": "Cluster Memory Usage",
"type": "gauge"
},
{
"datasource": {
"type": "prometheus",
"uid": "${DS_PROMETHEUS}"
},
"fieldConfig": {
"defaults": {
"color": {
"mode": "thresholds"
},
"mappings": [],
"thresholds": {
"mode": "absolute",
"steps": [
{
"color": "green",
"value": 0
},
{
"color": "red",
"value": 80
}
]
},
"unit": "percent"
},
"overrides": []
},
"gridPos": {
"h": 5,
"w": 5,
"x": 13,
"y": 20
},
"id": 19,
"options": {
"minVizHeight": 75,
"minVizWidth": 75,
"orientation": "auto",
"reduceOptions": {
"calcs": ["lastNotNull"],
"fields": "",
"values": false
},
"showThresholdLabels": false,
"showThresholdMarkers": true,
"sizing": "auto"
},
"pluginVersion": "12.1.1",
"targets": [
{
"editorMode": "code",
"expr": "(\n sum by (cluster) (node_filesystem_size_bytes{mountpoint=\"/\",cluster=\"$cluster\"})\n- sum by (cluster) (node_filesystem_avail_bytes{mountpoint=\"/\",cluster=\"$cluster\"})\n)\n/\nsum by (cluster) (node_filesystem_size_bytes{mountpoint=\"/\",cluster=\"$cluster\"})\n* 100",
"legendFormat": "__auto",
"range": true,
"refId": "A",
"datasource": {
"type": "prometheus",
"uid": "${DS_PROMETHEUS}"
}
}
],
"title": "Cluster Disk Usage",
"type": "gauge"
},
{
"datasource": {
"type": "prometheus",
"uid": "${DS_PROMETHEUS}"
},
"fieldConfig": {
"defaults": {
"color": {
"mode": "thresholds"
},
"mappings": [],
"thresholds": {
"mode": "absolute",
"steps": [
{
"color": "green",
"value": 0
},
{
"color": "red",
"value": 85
}
]
},
"unit": "percent"
},
"overrides": []
},
"gridPos": {
"h": 5,
"w": 6,
"x": 18,
"y": 20
},
"id": 17,
"options": {
"minVizHeight": 75,
"minVizWidth": 75,
"orientation": "auto",
"reduceOptions": {
"calcs": ["lastNotNull"],
"fields": "",
"values": false
},
"showThresholdLabels": false,
"showThresholdMarkers": true,
"sizing": "auto"
},
"pluginVersion": "12.1.1",
"targets": [
{
"editorMode": "code",
"expr": "sum(kube_pod_container_resource_requests{resource=\"cpu\",cluster=\"$cluster\"}) / sum(kube_node_status_capacity{resource=\"cpu\",cluster=\"$cluster\"}) * 100",
"legendFormat": "__auto",
"range": true,
"refId": "A",
"datasource": {
"type": "prometheus",
"uid": "${DS_PROMETHEUS}"
}
}
],
"title": "CPU Requests",
"type": "gauge"
},
{
"datasource": {
"type": "prometheus",
"uid": "${DS_PROMETHEUS}"
},
"fieldConfig": {
"defaults": {
"color": {
"mode": "palette-classic"
},
"custom": {
"axisBorderShow": false,
"axisCenteredZero": false,
"axisColorMode": "text",
"axisLabel": "",
"axisPlacement": "auto",
"axisSoftMax": 1,
"barAlignment": 0,
"barWidthFactor": 0.6,
"drawStyle": "line",
"fillOpacity": 0,
"gradientMode": "none",
"hideFrom": {
"legend": false,
"tooltip": false,
"viz": false
},
"insertNulls": false,
"lineInterpolation": "linear",
"lineWidth": 1,
"pointSize": 5,
"scaleDistribution": {
"type": "linear"
},
"showPoints": "auto",
"spanNulls": false,
"stacking": {
"group": "A",
"mode": "none"
},
"thresholdsStyle": {
"mode": "off"
}
},
"decimals": 0,
"mappings": [],
"thresholds": {
"mode": "absolute",
"steps": [
{
"color": "green",
"value": 0
},
{
"color": "red",
"value": 80
}
]
}
},
"overrides": []
},
"gridPos": {
"h": 8,
"w": 13,
"x": 0,
"y": 21
},
"id": 11,
"options": {
"legend": {
"calcs": [],
"displayMode": "list",
"placement": "bottom",
"showLegend": true
},
"tooltip": {
"hideZeros": false,
"mode": "single",
"sort": "none"
}
},
"pluginVersion": "12.1.1",
"targets": [
{
"editorMode": "code",
"expr": "avg_over_time(kube_persistentvolumeclaim_status_phase{phase=\"Pending\",cluster=\"$cluster\"}[1m])",
"legendFormat": "{{persistentvolumeclaim}} / {{cluster}}",
"range": true,
"refId": "A",
"datasource": {
"type": "prometheus",
"uid": "${DS_PROMETHEUS}"
}
}
],
"title": "PVC Pending",
"type": "timeseries"
},
{
"datasource": {
"type": "prometheus",
"uid": "${DS_PROMETHEUS}"
},
"fieldConfig": {
"defaults": {
"color": {
"mode": "thresholds"
},
"mappings": [],
"thresholds": {
"mode": "absolute",
"steps": [
{
"color": "green",
"value": 0
},
{
"color": "red",
"value": 80
}
]
},
"unit": "percent"
},
"overrides": []
},
"gridPos": {
"h": 5,
"w": 5,
"x": 13,
"y": 25
},
"id": 18,
"options": {
"minVizHeight": 75,
"minVizWidth": 75,
"orientation": "auto",
"reduceOptions": {
"calcs": ["lastNotNull"],
"fields": "",
"values": false
},
"showThresholdLabels": false,
"showThresholdMarkers": true,
"sizing": "auto"
},
"pluginVersion": "12.1.1",
"targets": [
{
"editorMode": "code",
"expr": "sum(kube_pod_container_resource_requests{resource=\"memory\",cluster=\"$cluster\"}) / sum(kube_node_status_capacity{resource=\"memory\",cluster=\"$cluster\"}) * 100",
"legendFormat": "__auto",
"range": true,
"refId": "A",
"datasource": {
"type": "prometheus",
"uid": "${DS_PROMETHEUS}"
}
}
],
"title": "Memory Requests",
"type": "gauge"
},
{
"datasource": {
"type": "prometheus",
"uid": "${DS_PROMETHEUS}"
},
"fieldConfig": {
"defaults": {
"color": {
"mode": "thresholds"
},
"mappings": [],
"thresholds": {
"mode": "absolute",
"steps": [
{
"color": "green",
"value": 0
},
{
"color": "red",
"value": 70
}
]
},
"unit": "percent"
},
"overrides": []
},
"gridPos": {
"h": 5,
"w": 6,
"x": 18,
"y": 25
},
"id": 32,
"options": {
"minVizHeight": 75,
"minVizWidth": 75,
"orientation": "auto",
"reduceOptions": {
"calcs": ["lastNotNull"],
"fields": "",
"values": false
},
"showThresholdLabels": false,
"showThresholdMarkers": true,
"sizing": "auto"
},
"pluginVersion": "12.1.1",
"targets": [
{
"editorMode": "code",
"expr": "(\n sum by(cluster)(\n kube_pod_container_resource_requests{resource=\"ephemeral_storage\",cluster=\"$cluster\"}\n )\n /\n sum by(cluster)(\n kube_node_status_allocatable{resource=\"ephemeral_storage\",cluster=\"$cluster\"}\n )\n) * 100",
"legendFormat": "__auto",
"range": true,
"refId": "A",
"datasource": {
"type": "prometheus",
"uid": "${DS_PROMETHEUS}"
}
}
],
"title": "Ephemeral Storage Requests",
"type": "gauge"
},
{
"datasource": {
"type": "prometheus",
"uid": "${DS_PROMETHEUS}"
},
"fieldConfig": {
"defaults": {
"color": {
"mode": "palette-classic"
},
"custom": {
"axisBorderShow": false,
"axisCenteredZero": false,
"axisColorMode": "text",
"axisLabel": "",
"axisPlacement": "auto",
"barAlignment": 0,
"barWidthFactor": 0.6,
"drawStyle": "line",
"fillOpacity": 0,
"gradientMode": "none",
"hideFrom": {
"legend": false,
"tooltip": false,
"viz": false
},
"insertNulls": false,
"lineInterpolation": "linear",
"lineWidth": 1,
"pointSize": 5,
"scaleDistribution": {
"type": "linear"
},
"showPoints": "auto",
"spanNulls": false,
"stacking": {
"group": "A",
"mode": "none"
},
"thresholdsStyle": {
"mode": "off"
}
},
"decimals": 0,
"mappings": [],
"thresholds": {
"mode": "absolute",
"steps": [
{
"color": "green",
"value": 0
},
{
"color": "red",
"value": 80
}
]
},
"unit": "percent"
},
"overrides": []
},
"gridPos": {
"h": 8,
"w": 13,
"x": 0,
"y": 29
},
"id": 21,
"options": {
"legend": {
"calcs": [],
"displayMode": "list",
"placement": "bottom",
"showLegend": true
},
"tooltip": {
"hideZeros": false,
"mode": "single",
"sort": "none"
}
},
"pluginVersion": "12.1.1",
"targets": [
{
"editorMode": "code",
"expr": "100 * (\n sum by(pod, namespace, cluster) (\n rate(pod_cpu_usage_seconds_total{cluster=\"$cluster\"}[5m])\n )\n /\n sum by(pod, namespace, cluster) (\n kube_pod_container_resource_limits{resource=\"cpu\", cluster=\"$cluster\"}\n )\n)",
"legendFormat": "{{pod}} / {{cluster}}",
"range": true,
"refId": "A",
"datasource": {
"type": "prometheus",
"uid": "${DS_PROMETHEUS}"
}
}
],
"title": "High CPU Pods",
"type": "timeseries"
},
{
"datasource": {
"type": "prometheus",
"uid": "${DS_PROMETHEUS}"
},
"fieldConfig": {
"defaults": {
"color": {
"mode": "thresholds"
},
"mappings": [],
"max": 100,
"min": 0,
"thresholds": {
"mode": "absolute",
"steps": [
{
"color": "green",
"value": 0
},
{
"color": "red",
"value": 80
}
]
},
"unit": "Mbits"
},
"overrides": []
},
"gridPos": {
"h": 5,
"w": 5,
"x": 13,
"y": 30
},
"id": 30,
"options": {
"minVizHeight": 75,
"minVizWidth": 75,
"orientation": "auto",
"reduceOptions": {
"calcs": ["lastNotNull"],
"fields": "",
"values": false
},
"showThresholdLabels": false,
"showThresholdMarkers": true,
"sizing": "auto"
},
"pluginVersion": "12.1.1",
"targets": [
{
"editorMode": "code",
"expr": "sum by (cluster) (\n rate(node_network_transmit_bytes_total{device!~\"lo|docker.*|cali.*\",cluster=\"$cluster\"}[5m])\n) * 8 / 1e6",
"legendFormat": "__auto",
"range": true,
"refId": "A",
"datasource": {
"type": "prometheus",
"uid": "${DS_PROMETHEUS}"
}
}
],
"title": "Outbound Traffic",
"type": "gauge"
},
{
"datasource": {
"type": "prometheus",
"uid": "${DS_PROMETHEUS}"
},
"fieldConfig": {
"defaults": {
"color": {
"mode": "thresholds"
},
"mappings": [],
"max": 100,
"min": 0,
"thresholds": {
"mode": "absolute",
"steps": [
{
"color": "green",
"value": 0
},
{
"color": "red",
"value": 80
}
]
},
"unit": "Mbits"
},
"overrides": []
},
"gridPos": {
"h": 5,
"w": 6,
"x": 18,
"y": 30
},
"id": 29,
"options": {
"minVizHeight": 75,
"minVizWidth": 75,
"orientation": "auto",
"reduceOptions": {
"calcs": ["lastNotNull"],
"fields": "",
"values": false
},
"showThresholdLabels": false,
"showThresholdMarkers": true,
"sizing": "auto"
},
"pluginVersion": "12.1.1",
"targets": [
{
"editorMode": "code",
"expr": "sum by (cluster)(\n rate(node_network_receive_bytes_total{device!~\"lo|docker.*|cali.*\",cluster=\"$cluster\"}[2m])\n) * 8 / 1e6",
"legendFormat": "__auto",
"range": true,
"refId": "A",
"datasource": {
"type": "prometheus",
"uid": "${DS_PROMETHEUS}"
}
}
],
"title": "Inbound Traffic",
"type": "gauge"
},
{
"datasource": {
"type": "prometheus",
"uid": "${DS_PROMETHEUS}"
},
"fieldConfig": {
"defaults": {
"color": {
"mode": "thresholds"
},
"decimals": 0,
"displayName": "Days",
"mappings": [],
"max": 365,
"min": 0,
"thresholds": {
"mode": "absolute",
"steps": [
{
"color": "dark-red",
"value": 0
},
{
"color": "dark-red",
"value": 7
},
{
"color": "#EAB839",
"value": 15
},
{
"color": "dark-green",
"value": 100
}
]
}
},
"overrides": []
},
"gridPos": {
"h": 6,
"w": 5,
"x": 13,
"y": 35
},
"id": 33,
"options": {
"minVizHeight": 75,
"minVizWidth": 75,
"orientation": "auto",
"reduceOptions": {
"calcs": ["lastNotNull"],
"fields": "",
"values": false
},
"showThresholdLabels": false,
"showThresholdMarkers": true,
"sizing": "auto"
},
"pluginVersion": "12.1.1",
"targets": [
{
"editorMode": "code",
"expr": "(probe_ssl_earliest_cert_expiry{instance=\"https://mywebsite.com\"} - time()) / 86400",
"legendFormat": "__auto",
"range": true,
"refId": "A",
"datasource": {
"type": "prometheus",
"uid": "${DS_PROMETHEUS}"
}
}
],
"title": "SSL Certificate Expiry Website 1",
"type": "gauge"
},
{
"datasource": {
"type": "prometheus",
"uid": "${DS_PROMETHEUS}"
},
"fieldConfig": {
"defaults": {
"color": {
"mode": "thresholds"
},
"displayName": "Days",
"mappings": [],
"max": 365,
"min": 0,
"thresholds": {
"mode": "absolute",
"steps": [
{
"color": "green",
"value": 0
},
{
"color": "red",
"value": 0
},
{
"color": "#EAB839",
"value": 45
},
{
"color": "green",
"value": 100
}
]
}
},
"overrides": []
},
"gridPos": {
"h": 6,
"w": 6,
"x": 18,
"y": 35
},
"id": 39,
"options": {
"minVizHeight": 75,
"minVizWidth": 75,
"orientation": "auto",
"reduceOptions": {
"calcs": ["lastNotNull"],
"fields": "",
"values": false
},
"showThresholdLabels": false,
"showThresholdMarkers": true,
"sizing": "auto"
},
"pluginVersion": "12.1.1",
"targets": [
{
"editorMode": "code",
"expr": "(probe_ssl_earliest_cert_expiry{exported_instance=\"https://mywebsite.com\"} - time()) / 86400",
"legendFormat": "__auto",
"range": true,
"refId": "A",
"datasource": {
"type": "prometheus",
"uid": "${DS_PROMETHEUS}"
}
}
],
"title": "Website 2 Domain SSL Certificate Expiry",
"type": "gauge"
},
{
"datasource": {
"type": "prometheus",
"uid": "${DS_PROMETHEUS}"
},
"fieldConfig": {
"defaults": {
"color": {
"mode": "palette-classic"
},
"custom": {
"axisBorderShow": false,
"axisCenteredZero": false,
"axisColorMode": "text",
"axisLabel": "",
"axisPlacement": "auto",
"barAlignment": 0,
"barWidthFactor": 0.6,
"drawStyle": "line",
"fillOpacity": 0,
"gradientMode": "none",
"hideFrom": {
"legend": false,
"tooltip": false,
"viz": false
},
"insertNulls": false,
"lineInterpolation": "linear",
"lineWidth": 1,
"pointSize": 5,
"scaleDistribution": {
"type": "linear"
},
"showPoints": "auto",
"spanNulls": false,
"stacking": {
"group": "A",
"mode": "none"
},
"thresholdsStyle": {
"mode": "off"
}
},
"mappings": [],
"thresholds": {
"mode": "absolute",
"steps": [
{
"color": "green",
"value": 0
},
{
"color": "red",
"value": 80
}
]
},
"unit": "percent"
},
"overrides": []
},
"gridPos": {
"h": 8,
"w": 13,
"x": 0,
"y": 37
},
"id": 20,
"options": {
"legend": {
"calcs": [],
"displayMode": "list",
"placement": "bottom",
"showLegend": true
},
"tooltip": {
"hideZeros": false,
"mode": "single",
"sort": "none"
}
},
"pluginVersion": "12.1.1",
"targets": [
{
"editorMode": "code",
"expr": "100 * (sum by (pod, namespace,cluster) (pod_memory_working_set_bytes{cluster=\"$cluster\"}) \n/\nsum by (pod, namespace,cluster) (kube_pod_container_resource_limits{resource=\"memory\",cluster=\"$cluster\"}))",
"legendFormat": "{{pod}} / {{cluster}}",
"range": true,
"refId": "A",
"datasource": {
"type": "prometheus",
"uid": "${DS_PROMETHEUS}"
}
}
],
"title": "High Memory Pods",
"type": "timeseries"
},
{
"datasource": {
"type": "prometheus",
"uid": "${DS_PROMETHEUS}"
},
"fieldConfig": {
"defaults": {
"color": {
"mode": "palette-classic"
},
"custom": {
"axisBorderShow": false,
"axisCenteredZero": false,
"axisColorMode": "text",
"axisLabel": "",
"axisPlacement": "auto",
"barAlignment": 0,
"barWidthFactor": 0.6,
"drawStyle": "line",
"fillOpacity": 0,
"gradientMode": "none",
"hideFrom": {
"legend": false,
"tooltip": false,
"viz": false
},
"insertNulls": false,
"lineInterpolation": "linear",
"lineWidth": 1,
"pointSize": 5,
"scaleDistribution": {
"type": "linear"
},
"showPoints": "auto",
"spanNulls": false,
"stacking": {
"group": "A",
"mode": "none"
},
"thresholdsStyle": {
"mode": "off"
}
},
"decimals": 0,
"mappings": [],
"max": 1,
"thresholds": {
"mode": "absolute",
"steps": [
{
"color": "green",
"value": 0
},
{
"color": "red",
"value": 0
}
]
}
},
"overrides": []
},
"gridPos": {
"h": 8,
"w": 11,
"x": 13,
"y": 41
},
"id": 3,
"options": {
"legend": {
"calcs": [],
"displayMode": "list",
"placement": "bottom",
"showLegend": true
},
"tooltip": {
"hideZeros": false,
"mode": "single",
"sort": "none"
}
},
"pluginVersion": "12.1.1",
"targets": [
{
"editorMode": "code",
"expr": "kube_pod_status_phase{phase=\"Pending\",cluster=\"$cluster\"}",
"legendFormat": "{{pod}} / {{cluster}}",
"range": true,
"refId": "A",
"datasource": {
"type": "prometheus",
"uid": "${DS_PROMETHEUS}"
}
}
],
"title": "Pending Pods",
"type": "timeseries"
},
{
"datasource": {
"type": "prometheus",
"uid": "${DS_PROMETHEUS}"
},
"fieldConfig": {
"defaults": {
"color": {
"mode": "palette-classic"
},
"custom": {
"axisBorderShow": false,
"axisCenteredZero": false,
"axisColorMode": "text",
"axisLabel": "",
"axisPlacement": "auto",
"barAlignment": 0,
"barWidthFactor": 0.6,
"drawStyle": "line",
"fillOpacity": 0,
"gradientMode": "none",
"hideFrom": {
"legend": false,
"tooltip": false,
"viz": false
},
"insertNulls": false,
"lineInterpolation": "linear",
"lineWidth": 1,
"pointSize": 5,
"scaleDistribution": {
"type": "linear"
},
"showPoints": "auto",
"spanNulls": false,
"stacking": {
"group": "A",
"mode": "none"
},
"thresholdsStyle": {
"mode": "off"
}
},
"mappings": [],
"thresholds": {
"mode": "absolute",
"steps": [
{
"color": "green",
"value": 0
},
{
"color": "red",
"value": 80
}
]
}
},
"overrides": []
},
"gridPos": {
"h": 7,
"w": 13,
"x": 0,
"y": 45
},
"id": 2,
"options": {
"legend": {
"calcs": [],
"displayMode": "list",
"placement": "bottom",
"showLegend": true
},
"tooltip": {
"hideZeros": false,
"mode": "single",
"sort": "none"
}
},
"pluginVersion": "12.1.1",
"targets": [
{
"editorMode": "code",
"expr": "min_over_time(kube_daemonset_status_number_unavailable{cluster=\"$cluster\"}[5m])",
"legendFormat": "{{daemonset}} / {{cluster}}",
"range": true,
"refId": "A",
"datasource": {
"type": "prometheus",
"uid": "${DS_PROMETHEUS}"
}
}
],
"title": "Failing DaemonSets",
"type": "timeseries"
},
{
"datasource": {
"type": "prometheus",
"uid": "${DS_PROMETHEUS}"
},
"fieldConfig": {
"defaults": {
"color": {
"mode": "palette-classic"
},
"custom": {
"axisBorderShow": false,
"axisCenteredZero": false,
"axisColorMode": "text",
"axisLabel": "",
"axisPlacement": "auto",
"axisSoftMax": 1,
"barAlignment": 0,
"barWidthFactor": 0.6,
"drawStyle": "line",
"fillOpacity": 0,
"gradientMode": "none",
"hideFrom": {
"legend": false,
"tooltip": false,
"viz": false
},
"insertNulls": false,
"lineInterpolation": "linear",
"lineWidth": 1,
"pointSize": 5,
"scaleDistribution": {
"type": "linear"
},
"showPoints": "auto",
"spanNulls": false,
"stacking": {
"group": "A",
"mode": "none"
},
"thresholdsStyle": {
"mode": "off"
}
},
"decimals": 0,
"mappings": [],
"thresholds": {
"mode": "absolute",
"steps": [
{
"color": "green",
"value": 0
},
{
"color": "red",
"value": 80
}
]
}
},
"overrides": []
},
"gridPos": {
"h": 9,
"w": 11,
"x": 13,
"y": 49
},
"id": 12,
"options": {
"legend": {
"calcs": [],
"displayMode": "list",
"placement": "bottom",
"showLegend": true
},
"tooltip": {
"hideZeros": false,
"mode": "single",
"sort": "none"
}
},
"pluginVersion": "12.1.1",
"targets": [
{
"editorMode": "code",
"expr": "min_over_time(kube_pod_status_reason{reason=\"Evicted\",cluster=\"$cluster\"}[1m])",
"legendFormat": "{{pod}} / {{cluster}}",
"range": true,
"refId": "A",
"datasource": {
"type": "prometheus",
"uid": "${DS_PROMETHEUS}"
}
}
],
"title": "Evicted Pod",
"type": "timeseries"
},
{
"datasource": {
"type": "prometheus",
"uid": "${DS_PROMETHEUS}"
},
"fieldConfig": {
"defaults": {
"color": {
"mode": "palette-classic"
},
"custom": {
"axisBorderShow": false,
"axisCenteredZero": false,
"axisColorMode": "text",
"axisLabel": "",
"axisPlacement": "auto",
"barAlignment": 0,
"barWidthFactor": 0.6,
"drawStyle": "line",
"fillOpacity": 0,
"gradientMode": "none",
"hideFrom": {
"legend": false,
"tooltip": false,
"viz": false
},
"insertNulls": false,
"lineInterpolation": "linear",
"lineWidth": 1,
"pointSize": 5,
"scaleDistribution": {
"type": "linear"
},
"showPoints": "auto",
"spanNulls": false,
"stacking": {
"group": "A",
"mode": "none"
},
"thresholdsStyle": {
"mode": "off"
}
},
"decimals": 0,
"mappings": [],
"max": 1,
"thresholds": {
"mode": "absolute",
"steps": [
{
"color": "green",
"value": 0
},
{
"color": "red",
"value": 80
}
]
}
},
"overrides": []
},
"gridPos": {
"h": 8,
"w": 13,
"x": 0,
"y": 52
},
"id": 22,
"options": {
"legend": {
"calcs": [],
"displayMode": "list",
"placement": "bottom",
"showLegend": true
},
"tooltip": {
"hideZeros": false,
"mode": "single",
"sort": "none"
}
},
"pluginVersion": "12.1.1",
"targets": [
{
"editorMode": "code",
"expr": "kube_node_status_condition{condition=\"DiskPressure\",status=\"true\",cluster=\"$cluster\"}",
"legendFormat": "{{node}} / {{cluster}}",
"range": true,
"refId": "A",
"datasource": {
"type": "prometheus",
"uid": "${DS_PROMETHEUS}"
}
}
],
"title": "Disk Pressure",
"type": "timeseries"
},
{
"datasource": {
"type": "prometheus",
"uid": "${DS_PROMETHEUS}"
},
"fieldConfig": {
"defaults": {
"color": {
"mode": "palette-classic"
},
"custom": {
"axisBorderShow": false,
"axisCenteredZero": false,
"axisColorMode": "text",
"axisLabel": "",
"axisPlacement": "auto",
"barAlignment": 0,
"barWidthFactor": 0.6,
"drawStyle": "line",
"fillOpacity": 0,
"gradientMode": "none",
"hideFrom": {
"legend": false,
"tooltip": false,
"viz": false
},
"insertNulls": false,
"lineInterpolation": "linear",
"lineWidth": 1,
"pointSize": 5,
"scaleDistribution": {
"type": "linear"
},
"showPoints": "auto",
"spanNulls": false,
"stacking": {
"group": "A",
"mode": "none"
},
"thresholdsStyle": {
"mode": "off"
}
},
"mappings": [],
"thresholds": {
"mode": "absolute",
"steps": [
{
"color": "green",
"value": 0
},
{
"color": "red",
"value": 80
}
]
}
},
"overrides": []
},
"gridPos": {
"h": 8,
"w": 11,
"x": 13,
"y": 58
},
"id": 10,
"options": {
"legend": {
"calcs": [],
"displayMode": "list",
"placement": "bottom",
"showLegend": true
},
"tooltip": {
"hideZeros": false,
"mode": "single",
"sort": "none"
}
},
"pluginVersion": "12.1.1",
"targets": [
{
"editorMode": "code",
"exemplar": false,
"expr": "increase(kube_pod_container_status_restarts_total{cluster=\"$cluster\"}[1m])",
"instant": false,
"legendFormat": "{{container}} / {{cluster}}",
"range": true,
"refId": "A",
"datasource": {
"type": "prometheus",
"uid": "${DS_PROMETHEUS}"
}
}
],
"title": "Pod Restarted",
"type": "timeseries"
},
{
"datasource": {
"type": "prometheus",
"uid": "${DS_PROMETHEUS}"
},
"fieldConfig": {
"defaults": {
"color": {
"mode": "palette-classic"
},
"custom": {
"axisBorderShow": false,
"axisCenteredZero": false,
"axisColorMode": "text",
"axisLabel": "",
"axisPlacement": "auto",
"axisSoftMax": 1,
"barAlignment": 0,
"barWidthFactor": 0.6,
"drawStyle": "line",
"fillOpacity": 0,
"gradientMode": "none",
"hideFrom": {
"legend": false,
"tooltip": false,
"viz": false
},
"insertNulls": false,
"lineInterpolation": "linear",
"lineWidth": 1,
"pointSize": 5,
"scaleDistribution": {
"type": "linear"
},
"showPoints": "auto",
"spanNulls": false,
"stacking": {
"group": "A",
"mode": "none"
},
"thresholdsStyle": {
"mode": "off"
}
},
"decimals": 0,
"mappings": [],
"thresholds": {
"mode": "absolute",
"steps": [
{
"color": "green",
"value": 0
},
{
"color": "red",
"value": 80
}
]
}
},
"overrides": []
},
"gridPos": {
"h": 7,
"w": 13,
"x": 0,
"y": 60
},
"id": 23,
"options": {
"legend": {
"calcs": [],
"displayMode": "list",
"placement": "bottom",
"showLegend": true
},
"tooltip": {
"hideZeros": false,
"mode": "single",
"sort": "none"
}
},
"pluginVersion": "12.1.1",
"targets": [
{
"editorMode": "code",
"expr": "kube_node_status_condition{condition=\"Ready\", status=\"false\",cluster=\"$cluster\"}",
"legendFormat": "{{node}} / {{cluster}}",
"range": true,
"refId": "A",
"datasource": {
"type": "prometheus",
"uid": "${DS_PROMETHEUS}"
}
}
],
"title": "Node Not Ready",
"type": "timeseries"
},
{
"datasource": {
"type": "prometheus",
"uid": "${DS_PROMETHEUS}"
},
"fieldConfig": {
"defaults": {
"color": {
"mode": "palette-classic"
},
"custom": {
"axisBorderShow": false,
"axisCenteredZero": false,
"axisColorMode": "text",
"axisLabel": "",
"axisPlacement": "auto",
"barAlignment": 0,
"barWidthFactor": 0.6,
"drawStyle": "line",
"fillOpacity": 0,
"gradientMode": "none",
"hideFrom": {
"legend": false,
"tooltip": false,
"viz": false
},
"insertNulls": false,
"lineInterpolation": "linear",
"lineWidth": 1,
"pointSize": 5,
"scaleDistribution": {
"type": "linear"
},
"showPoints": "auto",
"spanNulls": false,
"stacking": {
"group": "A",
"mode": "none"
},
"thresholdsStyle": {
"mode": "off"
}
},
"decimals": 0,
"mappings": [],
"max": 1,
"thresholds": {
"mode": "absolute",
"steps": [
{
"color": "green",
"value": 0
},
{
"color": "red",
"value": 80
}
]
}
},
"overrides": []
},
"gridPos": {
"h": 8,
"w": 11,
"x": 13,
"y": 66
},
"id": 31,
"options": {
"legend": {
"calcs": [],
"displayMode": "list",
"placement": "bottom",
"showLegend": true
},
"tooltip": {
"hideZeros": false,
"mode": "single",
"sort": "none"
}
},
"pluginVersion": "12.1.1",
"targets": [
{
"editorMode": "code",
"expr": "kube_node_status_condition{condition=\"Ready\", status=\"unknown\",cluster=\"$cluster\"}",
"legendFormat": "{{node}} / {{cluster}}",
"range": true,
"refId": "A",
"datasource": {
"type": "prometheus",
"uid": "${DS_PROMETHEUS}"
}
}
],
"title": "Node Status Unknown",
"type": "timeseries"
},
{
"datasource": {
"type": "prometheus",
"uid": "${DS_PROMETHEUS}"
},
"fieldConfig": {
"defaults": {
"color": {
"mode": "palette-classic"
},
"custom": {
"axisBorderShow": false,
"axisCenteredZero": false,
"axisColorMode": "text",
"axisLabel": "",
"axisPlacement": "auto",
"barAlignment": 0,
"barWidthFactor": 0.6,
"drawStyle": "line",
"fillOpacity": 0,
"gradientMode": "none",
"hideFrom": {
"legend": false,
"tooltip": false,
"viz": false
},
"insertNulls": false,
"lineInterpolation": "linear",
"lineWidth": 1,
"pointSize": 5,
"scaleDistribution": {
"type": "linear"
},
"showPoints": "auto",
"spanNulls": false,
"stacking": {
"group": "A",
"mode": "none"
},
"thresholdsStyle": {
"mode": "off"
}
},
"mappings": [],
"thresholds": {
"mode": "absolute",
"steps": [
{
"color": "green",
"value": 0
},
{
"color": "red",
"value": 80
}
]
},
"unit": "s"
},
"overrides": []
},
"gridPos": {
"h": 9,
"w": 13,
"x": 0,
"y": 67
},
"id": 38,
"options": {
"legend": {
"calcs": [],
"displayMode": "list",
"placement": "bottom",
"showLegend": true
},
"tooltip": {
"hideZeros": false,
"mode": "single",
"sort": "none"
}
},
"pluginVersion": "12.1.1",
"targets": [
{
"editorMode": "code",
"expr": "probe_dns_lookup_time_seconds{cluster=\"$cluster\"}",
"format": "time_series",
"legendFormat": "{{exported_instance}} {{instance}} / {{cluster}}",
"range": true,
"refId": "A",
"datasource": {
"type": "prometheus",
"uid": "${DS_PROMETHEUS}"
}
}
],
"title": "DNS Resolution Time",
"type": "timeseries"
},
{
"datasource": {
"type": "prometheus",
"uid": "${DS_PROMETHEUS}"
},
"fieldConfig": {
"defaults": {
"color": {
"mode": "palette-classic"
},
"custom": {
"axisBorderShow": false,
"axisCenteredZero": false,
"axisColorMode": "text",
"axisLabel": "",
"axisPlacement": "auto",
"barAlignment": 0,
"barWidthFactor": 0.6,
"drawStyle": "line",
"fillOpacity": 0,
"gradientMode": "none",
"hideFrom": {
"legend": false,
"tooltip": false,
"viz": false
},
"insertNulls": false,
"lineInterpolation": "linear",
"lineWidth": 1,
"pointSize": 5,
"scaleDistribution": {
"type": "linear"
},
"showPoints": "auto",
"spanNulls": false,
"stacking": {
"group": "A",
"mode": "none"
},
"thresholdsStyle": {
"mode": "off"
}
},
"decimals": 0,
"mappings": [],
"thresholds": {
"mode": "absolute",
"steps": [
{
"color": "green",
"value": 0
},
{
"color": "red",
"value": 80
}
]
},
"unit": "percent"
},
"overrides": []
},
"gridPos": {
"h": 7,
"w": 11,
"x": 13,
"y": 74
},
"id": 24,
"options": {
"legend": {
"calcs": [],
"displayMode": "list",
"placement": "bottom",
"showLegend": true
},
"tooltip": {
"hideZeros": false,
"mode": "single",
"sort": "none"
}
},
"pluginVersion": "12.1.1",
"targets": [
{
"editorMode": "code",
"expr": "100 * (kubelet_volume_stats_used_bytes{cluster=\"$cluster\"} /\n kubelet_volume_stats_capacity_bytes{cluster=\"$cluster\"})",
"legendFormat": "{{persistentvolumeclaim}} / {{cluster}}",
"range": true,
"refId": "A",
"datasource": {
"type": "prometheus",
"uid": "${DS_PROMETHEUS}"
}
}
],
"title": "PVC Usage",
"type": "timeseries"
},
{
"datasource": {
"type": "prometheus",
"uid": "${DS_PROMETHEUS}"
},
"fieldConfig": {
"defaults": {
"color": {
"mode": "palette-classic"
},
"custom": {
"axisBorderShow": false,
"axisCenteredZero": false,
"axisColorMode": "text",
"axisLabel": "",
"axisPlacement": "auto",
"axisSoftMax": 1,
"barAlignment": 0,
"barWidthFactor": 0.6,
"drawStyle": "line",
"fillOpacity": 0,
"gradientMode": "none",
"hideFrom": {
"legend": false,
"tooltip": false,
"viz": false
},
"insertNulls": false,
"lineInterpolation": "linear",
"lineWidth": 1,
"pointSize": 5,
"scaleDistribution": {
"type": "linear"
},
"showPoints": "auto",
"spanNulls": false,
"stacking": {
"group": "A",
"mode": "none"
},
"thresholdsStyle": {
"mode": "off"
}
},
"decimals": 0,
"mappings": [],
"thresholds": {
"mode": "absolute",
"steps": [
{
"color": "green",
"value": 0
},
{
"color": "red",
"value": 80
}
]
}
},
"overrides": []
},
"gridPos": {
"h": 7,
"w": 13,
"x": 0,
"y": 76
},
"id": 26,
"options": {
"legend": {
"calcs": [],
"displayMode": "list",
"placement": "bottom",
"showLegend": true
},
"tooltip": {
"hideZeros": false,
"mode": "single",
"sort": "none"
}
},
"pluginVersion": "12.1.1",
"targets": [
{
"editorMode": "code",
"expr": "kube_node_status_condition{condition=\"MemoryPressure\",status=\"true\",cluster=\"$cluster\"}",
"legendFormat": "{{node}} / {{cluster}}",
"range": true,
"refId": "A",
"datasource": {
"type": "prometheus",
"uid": "${DS_PROMETHEUS}"
}
}
],
"title": "Memory Pressure",
"type": "timeseries"
},
{
"datasource": {
"type": "prometheus",
"uid": "${DS_PROMETHEUS}"
},
"fieldConfig": {
"defaults": {
"color": {
"mode": "palette-classic"
},
"custom": {
"axisBorderShow": false,
"axisCenteredZero": false,
"axisColorMode": "text",
"axisLabel": "",
"axisPlacement": "auto",
"axisSoftMax": 1,
"barAlignment": 0,
"barWidthFactor": 0.6,
"drawStyle": "line",
"fillOpacity": 0,
"gradientMode": "none",
"hideFrom": {
"legend": false,
"tooltip": false,
"viz": false
},
"insertNulls": false,
"lineInterpolation": "linear",
"lineWidth": 1,
"pointSize": 5,
"scaleDistribution": {
"type": "linear"
},
"showPoints": "auto",
"spanNulls": false,
"stacking": {
"group": "A",
"mode": "none"
},
"thresholdsStyle": {
"mode": "off"
}
},
"decimals": 0,
"mappings": [],
"thresholds": {
"mode": "absolute",
"steps": [
{
"color": "green",
"value": 0
},
{
"color": "red",
"value": 80
}
]
}
},
"overrides": []
},
"gridPos": {
"h": 7,
"w": 11,
"x": 13,
"y": 81
},
"id": 25,
"options": {
"legend": {
"calcs": [],
"displayMode": "list",
"placement": "bottom",
"showLegend": true
},
"tooltip": {
"hideZeros": false,
"mode": "single",
"sort": "none"
}
},
"pluginVersion": "12.1.1",
"targets": [
{
"editorMode": "code",
"expr": "kube_node_status_condition{condition=\"PIDPressure\",status=\"true\",cluster=\"$cluster\"}",
"legendFormat": "{{node}} / {{cluster}}",
"range": true,
"refId": "A",
"datasource": {
"type": "prometheus",
"uid": "${DS_PROMETHEUS}"
}
}
],
"title": "PID Pressure",
"type": "timeseries"
},
{
"datasource": {
"type": "prometheus",
"uid": "${DS_PROMETHEUS}"
},
"fieldConfig": {
"defaults": {
"color": {
"mode": "palette-classic"
},
"custom": {
"axisBorderShow": false,
"axisCenteredZero": false,
"axisColorMode": "text",
"axisLabel": "",
"axisPlacement": "auto",
"barAlignment": 0,
"barWidthFactor": 0.6,
"drawStyle": "line",
"fillOpacity": 0,
"gradientMode": "none",
"hideFrom": {
"legend": false,
"tooltip": false,
"viz": false
},
"insertNulls": false,
"lineInterpolation": "linear",
"lineWidth": 1,
"pointSize": 5,
"scaleDistribution": {
"type": "linear"
},
"showPoints": "auto",
"spanNulls": false,
"stacking": {
"group": "A",
"mode": "none"
},
"thresholdsStyle": {
"mode": "off"
}
},
"decimals": 0,
"mappings": [],
"thresholds": {
"mode": "absolute",
"steps": [
{
"color": "green",
"value": 0
},
{
"color": "red",
"value": 80
}
]
}
},
"overrides": []
},
"gridPos": {
"h": 8,
"w": 13,
"x": 0,
"y": 83
},
"id": 27,
"options": {
"legend": {
"calcs": [],
"displayMode": "list",
"placement": "bottom",
"showLegend": true
},
"tooltip": {
"hideZeros": false,
"mode": "single",
"sort": "none"
}
},
"pluginVersion": "12.1.1",
"targets": [
{
"editorMode": "code",
"expr": "kube_poddisruptionbudget_status_desired_healthy{cluster=\"$cluster\"}\n-\nkube_poddisruptionbudget_status_current_healthy{cluster=\"$cluster\"}",
"legendFormat": "{{poddisruptionbudget}} / {{cluster}}",
"range": true,
"refId": "A",
"datasource": {
"type": "prometheus",
"uid": "${DS_PROMETHEUS}"
}
}
],
"title": "Pod Disruption Budget",
"type": "timeseries"
},
{
"datasource": {
"type": "prometheus",
"uid": "${DS_PROMETHEUS}"
},
"fieldConfig": {
"defaults": {
"color": {
"mode": "palette-classic"
},
"custom": {
"axisBorderShow": false,
"axisCenteredZero": false,
"axisColorMode": "text",
"axisLabel": "",
"axisPlacement": "auto",
"barAlignment": 0,
"barWidthFactor": 0.6,
"drawStyle": "line",
"fillOpacity": 0,
"gradientMode": "none",
"hideFrom": {
"legend": false,
"tooltip": false,
"viz": false
},
"insertNulls": false,
"lineInterpolation": "linear",
"lineWidth": 1,
"pointSize": 5,
"scaleDistribution": {
"type": "linear"
},
"showPoints": "auto",
"spanNulls": false,
"stacking": {
"group": "A",
"mode": "none"
},
"thresholdsStyle": {
"mode": "off"
}
},
"decimals": 0,
"mappings": [],
"thresholds": {
"mode": "absolute",
"steps": [
{
"color": "green",
"value": 0
},
{
"color": "red",
"value": 80
}
]
},
"unit": "percent"
},
"overrides": []
},
"gridPos": {
"h": 9,
"w": 11,
"x": 13,
"y": 88
},
"id": 35,
"options": {
"legend": {
"calcs": [],
"displayMode": "list",
"placement": "bottom",
"showLegend": true
},
"tooltip": {
"hideZeros": false,
"mode": "single",
"sort": "none"
}
},
"pluginVersion": "12.1.1",
"targets": [
{
"editorMode": "code",
"expr": "100 * (1 - (node_memory_MemAvailable_bytes{cluster=\"$cluster\"} / node_memory_MemTotal_bytes{cluster=\"$cluster\"}))",
"legendFormat": "{{node}} / {{cluster}}",
"range": true,
"refId": "A",
"datasource": {
"type": "prometheus",
"uid": "${DS_PROMETHEUS}"
}
}
],
"title": "Node Memory Usage",
"type": "timeseries"
},
{
"datasource": {
"type": "prometheus",
"uid": "${DS_PROMETHEUS}"
},
"fieldConfig": {
"defaults": {
"color": {
"mode": "palette-classic"
},
"custom": {
"axisBorderShow": false,
"axisCenteredZero": false,
"axisColorMode": "text",
"axisLabel": "",
"axisPlacement": "auto",
"barAlignment": 0,
"barWidthFactor": 0.6,
"drawStyle": "line",
"fillOpacity": 0,
"gradientMode": "none",
"hideFrom": {
"legend": false,
"tooltip": false,
"viz": false
},
"insertNulls": false,
"lineInterpolation": "linear",
"lineWidth": 1,
"pointSize": 5,
"scaleDistribution": {
"type": "linear"
},
"showPoints": "auto",
"spanNulls": false,
"stacking": {
"group": "A",
"mode": "none"
},
"thresholdsStyle": {
"mode": "off"
}
},
"decimals": 0,
"mappings": [],
"thresholds": {
"mode": "absolute",
"steps": [
{
"color": "green",
"value": 0
},
{
"color": "red",
"value": 80
}
]
},
"unit": "percent"
},
"overrides": []
},
"gridPos": {
"h": 9,
"w": 13,
"x": 0,
"y": 91
},
"id": 37,
"options": {
"legend": {
"calcs": [],
"displayMode": "list",
"placement": "bottom",
"showLegend": true
},
"tooltip": {
"hideZeros": false,
"mode": "single",
"sort": "none"
}
},
"pluginVersion": "12.1.1",
"targets": [
{
"editorMode": "code",
"expr": "(\n sum by (cluster) (kubelet_running_pods{cluster=\"$cluster\"})\n /\n sum by (cluster) (kube_node_status_allocatable{resource=\"pods\",cluster=\"$cluster\"})\n) * 100",
"legendFormat": "{{cluster}}",
"range": true,
"refId": "A",
"datasource": {
"type": "prometheus",
"uid": "${DS_PROMETHEUS}"
}
}
],
"title": "No Of Pods",
"type": "timeseries"
},
{
"datasource": {
"type": "prometheus",
"uid": "${DS_PROMETHEUS}"
},
"fieldConfig": {
"defaults": {
"color": {
"mode": "palette-classic"
},
"custom": {
"axisBorderShow": false,
"axisCenteredZero": false,
"axisColorMode": "text",
"axisLabel": "",
"axisPlacement": "auto",
"barAlignment": 0,
"barWidthFactor": 0.6,
"drawStyle": "line",
"fillOpacity": 0,
"gradientMode": "none",
"hideFrom": {
"legend": false,
"tooltip": false,
"viz": false
},
"insertNulls": false,
"lineInterpolation": "linear",
"lineWidth": 1,
"pointSize": 5,
"scaleDistribution": {
"type": "linear"
},
"showPoints": "auto",
"spanNulls": false,
"stacking": {
"group": "A",
"mode": "none"
},
"thresholdsStyle": {
"mode": "off"
}
},
"decimals": 0,
"mappings": [],
"thresholds": {
"mode": "absolute",
"steps": [
{
"color": "green",
"value": 0
},
{
"color": "red",
"value": 80
}
]
},
"unit": "percent"
},
"overrides": []
},
"gridPos": {
"h": 10,
"w": 11,
"x": 13,
"y": 97
},
"id": 34,
"options": {
"legend": {
"calcs": [],
"displayMode": "list",
"placement": "bottom",
"showLegend": true
},
"tooltip": {
"hideZeros": false,
"mode": "single",
"sort": "none"
}
},
"pluginVersion": "12.1.1",
"targets": [
{
"editorMode": "code",
"expr": "100 * (1 - avg by(cluster, node)(irate(node_cpu_seconds_total{mode=\"idle\",cluster=\"$cluster\"}[5m])))",
"legendFormat": "{{node}} / {{cluster}}",
"range": true,
"refId": "A",
"datasource": {
"type": "prometheus",
"uid": "${DS_PROMETHEUS}"
}
}
],
"title": "Node CPU Usage",
"type": "timeseries"
},
{
"datasource": {
"type": "prometheus",
"uid": "${DS_PROMETHEUS}"
},
"fieldConfig": {
"defaults": {
"color": {
"mode": "palette-classic"
},
"custom": {
"axisBorderShow": false,
"axisCenteredZero": false,
"axisColorMode": "text",
"axisLabel": "",
"axisPlacement": "auto",
"barAlignment": 0,
"barWidthFactor": 0.6,
"drawStyle": "line",
"fillOpacity": 0,
"gradientMode": "none",
"hideFrom": {
"legend": false,
"tooltip": false,
"viz": false
},
"insertNulls": false,
"lineInterpolation": "linear",
"lineWidth": 1,
"pointSize": 5,
"scaleDistribution": {
"type": "linear"
},
"showPoints": "auto",
"spanNulls": false,
"stacking": {
"group": "A",
"mode": "none"
},
"thresholdsStyle": {
"mode": "off"
}
},
"mappings": [],
"thresholds": {
"mode": "absolute",
"steps": [
{
"color": "green",
"value": 0
},
{
"color": "red",
"value": 80
}
]
}
},
"overrides": []
},
"gridPos": {
"h": 8,
"w": 13,
"x": 0,
"y": 100
},
"id": 28,
"options": {
"legend": {
"calcs": [],
"displayMode": "list",
"placement": "bottom",
"showLegend": true
},
"tooltip": {
"hideZeros": false,
"mode": "single",
"sort": "none"
}
},
"pluginVersion": "12.1.1",
"targets": [
{
"editorMode": "code",
"expr": "kube_horizontalpodautoscaler_status_desired_replicas{cluster=\"$cluster\"}\n-\nkube_horizontalpodautoscaler_status_current_replicas{cluster=\"$cluster\"}",
"legendFormat": "{{horizontalpodautoscaler}} / {{cluster}}",
"range": true,
"refId": "A",
"datasource": {
"type": "prometheus",
"uid": "${DS_PROMETHEUS}"
}
}
],
"title": "Horizontal Pod Autoscaler",
"type": "timeseries"
},
{
"datasource": {
"type": "prometheus",
"uid": "${DS_PROMETHEUS}"
},
"fieldConfig": {
"defaults": {
"color": {
"mode": "palette-classic"
},
"custom": {
"axisBorderShow": false,
"axisCenteredZero": false,
"axisColorMode": "text",
"axisLabel": "",
"axisPlacement": "auto",
"barAlignment": 0,
"barWidthFactor": 0.6,
"drawStyle": "line",
"fillOpacity": 0,
"gradientMode": "none",
"hideFrom": {
"legend": false,
"tooltip": false,
"viz": false
},
"insertNulls": false,
"lineInterpolation": "linear",
"lineWidth": 1,
"pointSize": 5,
"scaleDistribution": {
"type": "linear"
},
"showPoints": "auto",
"spanNulls": false,
"stacking": {
"group": "A",
"mode": "none"
},
"thresholdsStyle": {
"mode": "off"
}
},
"mappings": [],
"thresholds": {
"mode": "absolute",
"steps": [
{
"color": "green",
"value": 0
},
{
"color": "red",
"value": 80
}
]
},
"unit": "percent"
},
"overrides": []
},
"gridPos": {
"h": 8,
"w": 13,
"x": 0,
"y": 108
},
"id": 36,
"options": {
"legend": {
"calcs": [],
"displayMode": "list",
"placement": "bottom",
"showLegend": true
},
"tooltip": {
"hideZeros": false,
"mode": "single",
"sort": "none"
}
},
"pluginVersion": "12.1.1",
"targets": [
{
"editorMode": "code",
"expr": "(\n sum by (cluster, node) (node_filesystem_size_bytes{mountpoint=\"/\",cluster=\"$cluster\"})\n- sum by (cluster, node) (node_filesystem_avail_bytes{mountpoint=\"/\",cluster=\"$cluster\"})\n)\n/\nsum by (cluster, node) (node_filesystem_size_bytes{mountpoint=\"/\",cluster=\"$cluster\"})\n* 100",
"legendFormat": "{{node}} / {{cluster}}",
"range": true,
"refId": "A",
"datasource": {
"type": "prometheus",
"uid": "${DS_PROMETHEUS}"
}
}
],
"title": "Node Disk Usage",
"type": "timeseries"
}
],
"refresh": "1m",
"schemaVersion": 41,
"tags": [],
"templating": {
"list": [
{
"allowCustomValue": false,
"current": {},
"definition": "label_values(cluster)",
"label": "Cluster",
"name": "cluster",
"options": [],
"query": {
"qryType": 1,
"query": "label_values(cluster)",
"refId": "PrometheusVariableQueryEditor-VariableQuery"
},
"refresh": 1,
"regex": "",
"type": "query"
}
]
},
"time": {
"from": "now-5m",
"to": "now"
},
"timepicker": {},
"timezone": "browser",
"title": "Kubernetes State Monitoring",
"uid": "1f48a084-d03d-49a4-aba3-56559b088022",
"version": 129,
"weekStart": ""
}Setup Alerts for Metrics that cross Threshold#
- I have manually setup the alerts in the Grafana Dashboard using Grafana Managed Alerts
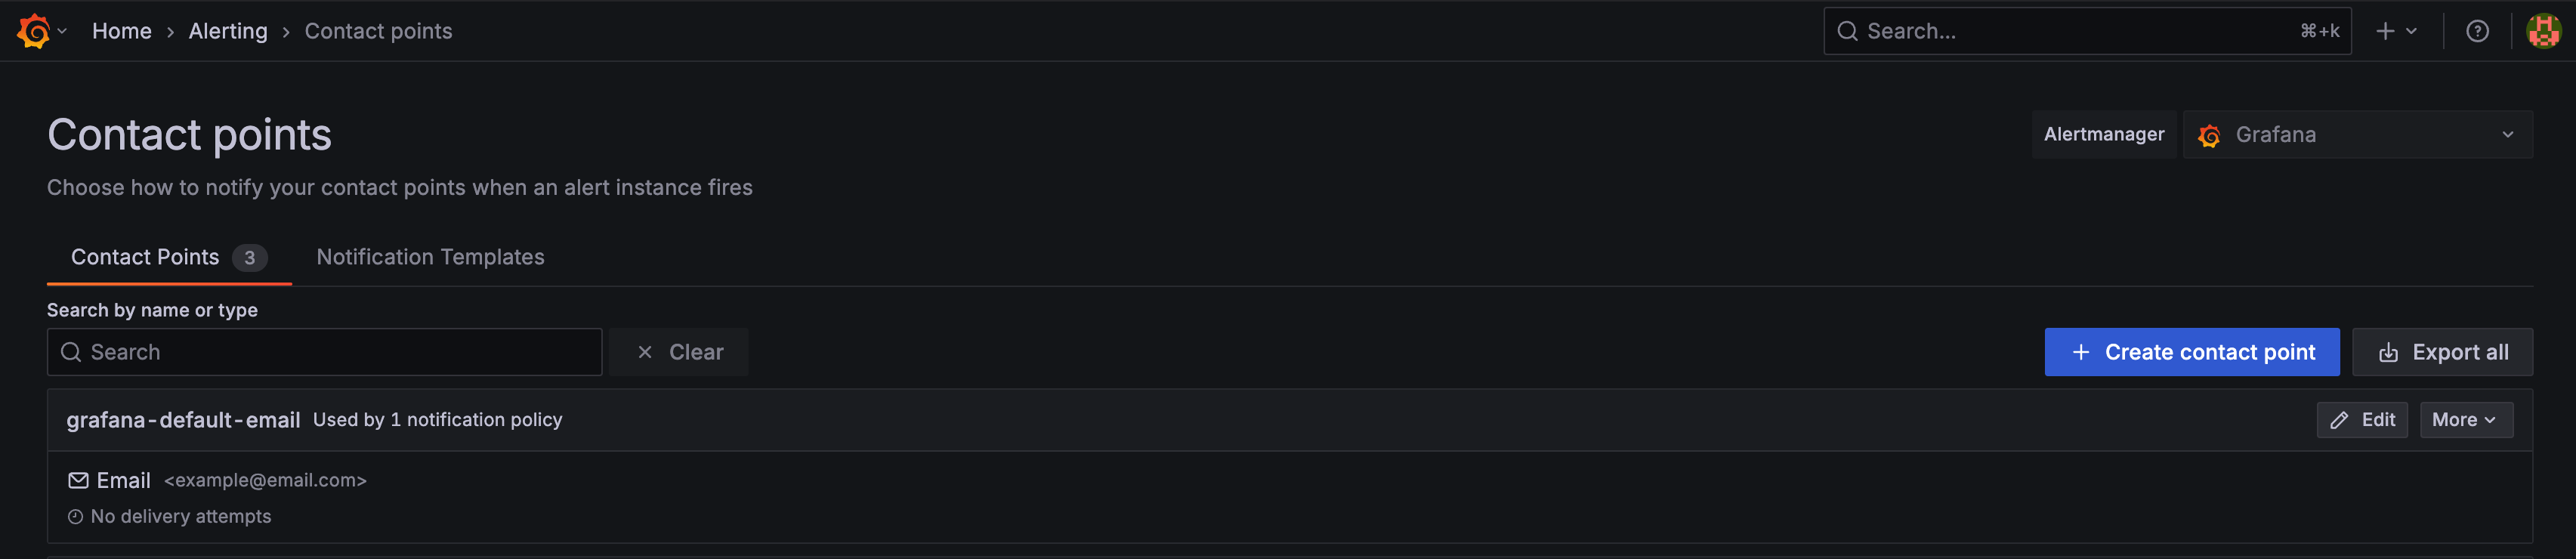
- Before we proceed to setting up alerts, we need to create a contact point.
- Contact point is simply the receiver of the emails that we will be sending for alerts
- Its present under Home > Alerting > Contact Points
- Click on Create Contact Point and enter the required details, also you can test by sending a sample email
- Here is the yaml version for the alerts that you can mount in the grafana pod to import the alerts
- For more information, refer this documentation
Alerts YAML File
apiVersion: 1
groups:
- orgId: 1
name: Prometheus
folder: Prometheus
interval: 30s
rules:
- uid: cexk94fgb8d8ge
title: Pod Restarted
condition: C
data:
- refId: A
relativeTimeRange:
from: 600
to: 0
datasourceUid: dexk3rxna5xq8b
model:
editorMode: code
expr: increase(kube_pod_container_status_restarts_total[5m])
instant: true
intervalMs: 1000
legendFormat: __auto
maxDataPoints: 43200
range: false
refId: A
- refId: C
datasourceUid: __expr__
model:
conditions:
- evaluator:
params:
- 5
type: gte
operator:
type: and
query:
params:
- C
reducer:
params: []
type: last
type: query
datasource:
type: __expr__
uid: __expr__
expression: A
intervalMs: 1000
maxDataPoints: 43200
refId: C
type: threshold
dashboardUid: 1f48a084-d03d-49a4-aba3-56559b088022
panelId: 10
noDataState: NoData
execErrState: Error
annotations:
__dashboardUid__: 1f48a084-d03d-49a4-aba3-56559b088022
__panelId__: '10'
isPaused: false
notification_settings:
receiver: My Alert Email
- uid: bexk9ih4oqgw0c
title: High CPU Pods ( 70% ) - Old
condition: C
data:
- refId: A
relativeTimeRange:
from: 600
to: 0
datasourceUid: dexk3rxna5xq8b
model:
editorMode: code
expr: |-
(
sum by (
container_label_io_kubernetes_pod_namespace,
container_label_io_kubernetes_pod_name,
cluster
) (
rate(container_cpu_usage_seconds_total{
container_label_io_cri_containerd_kind="container",
container_label_io_kubernetes_container_name!="POD"
}[5m])
)
/
on(container_label_io_kubernetes_pod_namespace, container_label_io_kubernetes_pod_name,cluster)
sum by (
container_label_io_kubernetes_pod_namespace,
container_label_io_kubernetes_pod_name,
cluster
) (
container_spec_cpu_quota{
container_label_io_cri_containerd_kind="container",
container_label_io_kubernetes_container_name!="POD"
}
/
container_spec_cpu_period{
container_label_io_cri_containerd_kind="container",
container_label_io_kubernetes_container_name!="POD"
}
)
) * 100
instant: true
intervalMs: 1000
legendFormat: __auto
maxDataPoints: 43200
range: false
refId: A
- refId: C
datasourceUid: __expr__
model:
conditions:
- evaluator:
params:
- 70
type: gt
operator:
type: and
query:
params:
- C
reducer:
params: []
type: last
type: query
datasource:
type: __expr__
uid: __expr__
expression: A
intervalMs: 1000
maxDataPoints: 43200
refId: C
type: threshold
noDataState: NoData
execErrState: Error
for: 1m
isPaused: true
notification_settings:
receiver: My Alert Email
- uid: aexk9m880jksgf
title: High Memory Pods ( 70% ) -Old
condition: C
data:
- refId: A
relativeTimeRange:
from: 600
to: 0
datasourceUid: dexk3rxna5xq8b
model:
editorMode: code
expr: |
(
sum by (
container_label_io_kubernetes_pod_namespace,
container_label_io_kubernetes_pod_name,
cluster
) (
container_memory_usage_bytes{
container_label_io_cri_containerd_kind="container",
container_label_io_kubernetes_container_name!="POD"
}
)
/
sum by (
container_label_io_kubernetes_pod_namespace,
container_label_io_kubernetes_pod_name,
cluster
) (
container_spec_memory_limit_bytes{
container_label_io_cri_containerd_kind="container",
container_label_io_kubernetes_container_name!="POD"
} > 0
) != +Inf
) * 100 > 0 < +Inf
instant: true
intervalMs: 1000
legendFormat: __auto
maxDataPoints: 43200
range: false
refId: A
- refId: C
datasourceUid: __expr__
model:
conditions:
- evaluator:
params:
- 70
type: gt
operator:
type: and
query:
params:
- C
reducer:
params: []
type: last
type: query
datasource:
type: __expr__
uid: __expr__
expression: A
intervalMs: 1000
maxDataPoints: 43200
refId: C
type: threshold
noDataState: NoData
execErrState: Error
for: 5m
isPaused: true
notification_settings:
receiver: My Alert Email
- uid: aexk9qeg57fnkc
title: Pending Pods
condition: C
data:
- refId: A
relativeTimeRange:
from: 600
to: 0
datasourceUid: dexk3rxna5xq8b
model:
editorMode: code
expr: min_over_time(kube_pod_status_phase{phase="Pending"}[1m])
instant: true
intervalMs: 1000
legendFormat: __auto
maxDataPoints: 43200
range: false
refId: A
- refId: C
datasourceUid: __expr__
model:
conditions:
- evaluator:
params:
- 0
type: gt
operator:
type: and
query:
params:
- C
reducer:
params: []
type: last
type: query
datasource:
type: __expr__
uid: __expr__
expression: A
intervalMs: 1000
maxDataPoints: 43200
refId: C
type: threshold
dashboardUid: 1f48a084-d03d-49a4-aba3-56559b088022
panelId: 3
noDataState: NoData
execErrState: Error
for: 5m
annotations:
__dashboardUid__: 1f48a084-d03d-49a4-aba3-56559b088022
__panelId__: '3'
isPaused: false
notification_settings:
receiver: My Alert Email
- uid: cexk9utdlmry8c
title: PVC Pending
condition: C
data:
- refId: A
relativeTimeRange:
from: 600
to: 0
datasourceUid: dexk3rxna5xq8b
model:
editorMode: code
expr: avg_over_time(kube_persistentvolumeclaim_status_phase{phase="Pending"}[1m])
instant: true
intervalMs: 1000
legendFormat: __auto
maxDataPoints: 43200
range: false
refId: A
- refId: C
datasourceUid: __expr__
model:
conditions:
- evaluator:
params:
- 0
type: gt
operator:
type: and
query:
params:
- C
reducer:
params: []
type: last
type: query
datasource:
type: __expr__
uid: __expr__
expression: A
intervalMs: 1000
maxDataPoints: 43200
refId: C
type: threshold
dashboardUid: 1f48a084-d03d-49a4-aba3-56559b088022
panelId: 11
noDataState: NoData
execErrState: Error
annotations:
__dashboardUid__: 1f48a084-d03d-49a4-aba3-56559b088022
__panelId__: '11'
isPaused: false
notification_settings:
receiver: My Alert Email
- uid: cexka7bdplvk0b
title: Pod Evicted
condition: C
data:
- refId: A
relativeTimeRange:
from: 600
to: 0
datasourceUid: dexk3rxna5xq8b
model:
editorMode: code
expr: increase(kube_pod_status_reason{reason="Evicted"}[1m])
instant: true
intervalMs: 1000
legendFormat: __auto
maxDataPoints: 43200
range: false
refId: A
- refId: C
datasourceUid: __expr__
model:
conditions:
- evaluator:
params:
- 1
type: eq
operator:
type: and
query:
params:
- C
reducer:
params: []
type: last
type: query
datasource:
type: __expr__
uid: __expr__
expression: A
intervalMs: 1000
maxDataPoints: 43200
refId: C
type: threshold
noDataState: NoData
execErrState: Error
isPaused: true
notification_settings:
receiver: My Email
- uid: eexkabrf4eqyod
title: Deployment Failing
condition: C
data:
- refId: A
relativeTimeRange:
from: 600
to: 0
datasourceUid: dexk3rxna5xq8b
model:
editorMode: code
expr: |-
avg_over_time(kube_deployment_status_condition{condition="Available", status="false"}[2m:])
or
avg_over_time(kube_deployment_status_condition{condition="Progressing", status="false"}[2m:])
instant: true
intervalMs: 1000
legendFormat: __auto
maxDataPoints: 43200
range: false
refId: A
- refId: C
datasourceUid: __expr__
model:
conditions:
- evaluator:
params:
- 0
type: gt
operator:
type: and
query:
params:
- C
reducer:
params: []
type: last
type: query
datasource:
type: __expr__
uid: __expr__
expression: A
intervalMs: 1000
maxDataPoints: 43200
refId: C
type: threshold
noDataState: NoData
execErrState: Error
for: 6m
isPaused: false
notification_settings:
receiver: My Alert Email
- uid: cexkaghnhan0ge
title: UI Down
condition: C
data:
- refId: A
relativeTimeRange:
from: 600
to: 0
datasourceUid: dexk3rxna5xq8b
model:
editorMode: code
expr: probe_http_status_code{type="ui"}
instant: true
intervalMs: 1000
legendFormat: __auto
maxDataPoints: 43200
range: false
refId: A
- refId: C
datasourceUid: __expr__
model:
conditions:
- evaluator:
params:
- 200
type: ne
operator:
type: and
query:
params:
- C
reducer:
params: []
type: last
type: query
datasource:
type: __expr__
uid: __expr__
expression: A
intervalMs: 1000
maxDataPoints: 43200
refId: C
type: threshold
dashboardUid: 1f48a084-d03d-49a4-aba3-56559b088022
panelId: 14
noDataState: NoData
execErrState: Error
for: 1m
annotations:
__dashboardUid__: 1f48a084-d03d-49a4-aba3-56559b088022
__panelId__: '14'
isPaused: true
notification_settings:
receiver: My Alert Email
repeat_interval: 5m
- uid: aexn5ts2mnsw0b
title: 'Node High CPU (70% ) '
condition: C
data:
- refId: A
relativeTimeRange:
from: 600
to: 0
datasourceUid: dexk3rxna5xq8b
model:
editorMode: code
expr: 100 * (1 - avg by(cluster, node)(irate(node_cpu_seconds_total{mode="idle"}[5m])))
instant: true
intervalMs: 1000
legendFormat: __auto
maxDataPoints: 43200
range: false
refId: A
- refId: C
datasourceUid: __expr__
model:
conditions:
- evaluator:
params:
- 70
type: gt
operator:
type: and
query:
params:
- C
reducer:
params: []
type: last
type: query
datasource:
type: __expr__
uid: __expr__
expression: A
intervalMs: 1000
maxDataPoints: 43200
refId: C
type: threshold
dashboardUid: 1f48a084-d03d-49a4-aba3-56559b088022
panelId: 34
noDataState: NoData
execErrState: Error
for: 5m
annotations:
__dashboardUid__: 1f48a084-d03d-49a4-aba3-56559b088022
__panelId__: '34'
isPaused: false
notification_settings:
receiver: My Alert Email
- uid: cexrxf1ku988wc
title: API Down
condition: C
data:
- refId: A
relativeTimeRange:
from: 600
to: 0
datasourceUid: dexk3rxna5xq8b
model:
editorMode: code
expr: probe_http_status_code{type="api"}
instant: true
intervalMs: 1000
legendFormat: __auto
maxDataPoints: 43200
range: false
refId: A
- refId: C
datasourceUid: __expr__
model:
conditions:
- evaluator:
params:
- 200
type: ne
operator:
type: and
query:
params:
- C
reducer:
params: []
type: last
type: query
datasource:
type: __expr__
uid: __expr__
expression: A
intervalMs: 1000
maxDataPoints: 43200
refId: C
type: threshold
dashboardUid: 1f48a084-d03d-49a4-aba3-56559b088022
panelId: 14
noDataState: NoData
execErrState: Error
for: 2m
annotations:
__dashboardUid__: 1f48a084-d03d-49a4-aba3-56559b088022
__panelId__: '14'
isPaused: false
notification_settings:
receiver: My Alert Email
repeat_interval: 5m
- uid: cexrxx2wgju9sd
title: Node High Memory ( 85% )
condition: C
data:
- refId: A
relativeTimeRange:
from: 600
to: 0
datasourceUid: dexk3rxna5xq8b
model:
editorMode: code
expr: 100 * (1 - (node_memory_MemAvailable_bytes / node_memory_MemTotal_bytes))
instant: true
intervalMs: 1000
legendFormat: __auto
maxDataPoints: 43200
range: false
refId: A
- refId: C
datasourceUid: __expr__
model:
conditions:
- evaluator:
params:
- 85
type: gt
operator:
type: and
query:
params:
- C
reducer:
params: []
type: last
type: query
datasource:
type: __expr__
uid: __expr__
expression: A
intervalMs: 1000
maxDataPoints: 43200
refId: C
type: threshold
dashboardUid: 1f48a084-d03d-49a4-aba3-56559b088022
panelId: 35
noDataState: NoData
execErrState: Error
for: 5m
annotations:
__dashboardUid__: 1f48a084-d03d-49a4-aba3-56559b088022
__panelId__: '35'
isPaused: false
notification_settings:
receiver: My Alert Email
- uid: aextq94beatxce
title: High Disk Usage ( 85% )
condition: C
data:
- refId: A
relativeTimeRange:
from: 600
to: 0
datasourceUid: dexk3rxna5xq8b
model:
editorMode: code
expr: |-
(
sum by (cluster, node) (node_filesystem_size_bytes{mountpoint="/"})
- sum by (cluster, node) (node_filesystem_avail_bytes{mountpoint="/"})
)
/
sum by (cluster, node) (node_filesystem_size_bytes{mountpoint="/"})
* 100
instant: true
intervalMs: 1000
legendFormat: __auto
maxDataPoints: 43200
range: false
refId: A
- refId: C
datasourceUid: __expr__
model:
conditions:
- evaluator:
params:
- 85
type: gt
operator:
type: and
query:
params:
- C
reducer:
params: []
type: last
type: query
datasource:
type: __expr__
uid: __expr__
expression: A
intervalMs: 1000
maxDataPoints: 43200
refId: C
type: threshold
dashboardUid: 1f48a084-d03d-49a4-aba3-56559b088022
panelId: 36
noDataState: NoData
execErrState: Error
for: 5m
annotations:
__dashboardUid__: 1f48a084-d03d-49a4-aba3-56559b088022
__panelId__: '36'
isPaused: false
notification_settings:
receiver: My Alert Email
- uid: dey2oiwtxcyrkd
title: Exporter Down
condition: C
data:
- refId: A
relativeTimeRange:
from: 600
to: 0
datasourceUid: dexk3rxna5xq8b
model:
editorMode: code
expr: up
instant: true
intervalMs: 1000
legendFormat: __auto
maxDataPoints: 43200
range: false
refId: A
- refId: C
datasourceUid: __expr__
model:
conditions:
- evaluator:
params:
- 1
type: ne
operator:
type: and
query:
params:
- C
reducer:
params: []
type: last
type: query
datasource:
type: __expr__
uid: __expr__
expression: A
intervalMs: 1000
maxDataPoints: 43200
refId: C
type: threshold
noDataState: NoData
execErrState: Error
for: 2m
isPaused: false
notification_settings:
receiver: My Alert Email
- uid: dey2qibqs52iof
title: Node Not Ready
condition: C
data:
- refId: A
relativeTimeRange:
from: 600
to: 0
datasourceUid: dexk3rxna5xq8b
model:
editorMode: code
expr: kube_node_status_condition{condition="Ready",status="true"}
instant: true
intervalMs: 1000
legendFormat: __auto
maxDataPoints: 43200
range: false
refId: A
- refId: C
datasourceUid: __expr__
model:
conditions:
- evaluator:
params:
- 1
type: ne
operator:
type: and
query:
params:
- C
reducer:
params: []
type: last
type: query
datasource:
type: __expr__
uid: __expr__
expression: A
intervalMs: 1000
maxDataPoints: 43200
refId: C
type: threshold
noDataState: NoData
execErrState: Error
for: 5m
isPaused: false
notification_settings:
receiver: My Alert Email
- uid: eey88fg8y0934a
title: High CPU Pods ( 70% )
condition: C
data:
- refId: A
relativeTimeRange:
from: 600
to: 0
datasourceUid: dexk3rxna5xq8b
model:
editorMode: code
expr: |-
100 * (
sum by(pod, namespace, cluster) (
rate(pod_cpu_usage_seconds_total[5m])
)
/
sum by(pod, namespace, cluster) (
kube_pod_container_resource_limits{resource="cpu"}
)
)
instant: true
intervalMs: 1000
legendFormat: __auto
maxDataPoints: 43200
range: false
refId: A
- refId: C
datasourceUid: __expr__
model:
conditions:
- evaluator:
params:
- 70
type: gt
operator:
type: and
query:
params:
- C
reducer:
params: []
type: last
type: query
datasource:
type: __expr__
uid: __expr__
expression: A
intervalMs: 1000
maxDataPoints: 43200
refId: C
type: threshold
dashboardUid: 1f48a084-d03d-49a4-aba3-56559b088022
panelId: 21
noDataState: NoData
execErrState: Error
for: 2m
annotations:
__dashboardUid__: 1f48a084-d03d-49a4-aba3-56559b088022
__panelId__: '21'
isPaused: true
notification_settings:
receiver: My Alert Email
- uid: cey89jnfm85j4b
title: High Memory Pods ( 70% )
condition: C
data:
- refId: A
relativeTimeRange:
from: 600
to: 0
datasourceUid: dexk3rxna5xq8b
model:
editorMode: code
expr: "100 * (sum by (pod, namespace,cluster) (pod_memory_working_set_bytes) \n/\nsum by (pod, namespace,cluster) (kube_pod_container_resource_limits{resource=\"memory\"}))"
instant: true
intervalMs: 1000
legendFormat: __auto
maxDataPoints: 43200
range: false
refId: A
- refId: C
datasourceUid: __expr__
model:
conditions:
- evaluator:
params:
- 70
type: gt
operator:
type: and
query:
params:
- C
reducer:
params: []
type: last
type: query
datasource:
type: __expr__
uid: __expr__
expression: A
intervalMs: 1000
maxDataPoints: 43200
refId: C
type: threshold
dashboardUid: 1f48a084-d03d-49a4-aba3-56559b088022
panelId: 20
noDataState: NoData
execErrState: Error
for: 5m
annotations:
__dashboardUid__: 1f48a084-d03d-49a4-aba3-56559b088022
__panelId__: '20'
isPaused: true
notification_settings:
receiver: My Alert Email
- uid: deytollpj9pfkc
title: Disk Pressure
condition: C
data:
- refId: A
relativeTimeRange:
from: 600
to: 0
datasourceUid: dexk3rxna5xq8b
model:
editorMode: code
expr: kube_node_status_condition{condition="DiskPressure",status="true"}
instant: true
intervalMs: 1000
legendFormat: __auto
maxDataPoints: 43200
range: false
refId: A
- refId: C
datasourceUid: __expr__
model:
conditions:
- evaluator:
params:
- 1
type: eq
operator:
type: and
query:
params:
- C
reducer:
params: []
type: last
type: query
datasource:
type: __expr__
uid: __expr__
expression: A
intervalMs: 1000
maxDataPoints: 43200
refId: C
type: threshold
dashboardUid: 1f48a084-d03d-49a4-aba3-56559b088022
panelId: 22
noDataState: NoData
execErrState: Error
for: 6m
annotations:
__dashboardUid__: 1f48a084-d03d-49a4-aba3-56559b088022
__panelId__: '22'
isPaused: false
notification_settings:
receiver: My Alert Email
- uid: cez44tx8d9l34e
title: PVC Usage Alert
condition: C
data:
- refId: A
relativeTimeRange:
from: 600
to: 0
datasourceUid: dexk3rxna5xq8b
model:
editorMode: code
expr: |-
100 * (kubelet_volume_stats_used_bytes{} /
kubelet_volume_stats_capacity_bytes{})
instant: true
intervalMs: 1000
legendFormat: __auto
maxDataPoints: 43200
range: false
refId: A
- refId: C
datasourceUid: __expr__
model:
conditions:
- evaluator:
params:
- 90
type: gt
operator:
type: and
query:
params:
- C
reducer:
params: []
type: last
type: query
datasource:
type: __expr__
uid: __expr__
expression: A
intervalMs: 1000
maxDataPoints: 43200
refId: C
type: threshold
dashboardUid: 1f48a084-d03d-49a4-aba3-56559b088022
panelId: 24
noDataState: NoData
execErrState: Error
for: 10m
annotations:
__dashboardUid__: 1f48a084-d03d-49a4-aba3-56559b088022
__panelId__: '24'
isPaused: false
notification_settings:
receiver: My Alert Email
- uid: af1hoqdltpw5ca
title: Node Status Unknown
condition: C
data:
- refId: A
relativeTimeRange:
from: 600
to: 0
datasourceUid: dexk3rxna5xq8b
model:
editorMode: code
expr: kube_node_status_condition{condition="Ready", status="unknown"}
instant: true
intervalMs: 1000
legendFormat: __auto
maxDataPoints: 43200
range: false
refId: A
- refId: C
datasourceUid: __expr__
model:
conditions:
- evaluator:
params:
- 1
type: eq
operator:
type: and
query:
params:
- C
reducer:
params: []
type: last
type: query
datasource:
type: __expr__
uid: __expr__
expression: A
intervalMs: 1000
maxDataPoints: 43200
refId: C
type: threshold
dashboardUid: 1f48a084-d03d-49a4-aba3-56559b088022
panelId: 31
noDataState: NoData
execErrState: Error
for: 2m
annotations:
__dashboardUid__: 1f48a084-d03d-49a4-aba3-56559b088022
__panelId__: '31'
isPaused: false
notification_settings:
receiver: My Alert Email